Dose Assessment for Inhabitants Evacuated from the 30-km Zone Soon after the Chernobyl Accident
Tetsuji Imanaka and Hiroaki Koide
Research Reactor Institute, Kyoto University
Kumatori-cho, Sennan-gun, Osaka 590-04, Japan
Introduction
The first detailed report about the consequences of the Chernobyl accident was presented to IAEA from the USSR government in August 1986, about 4 months later since the beginning of the accident [1]. According to this report, more than two hundred cases of acute radiation syndrome (ARS) occurred as a result of the accident, among which 29 persons died (besides, two persons died on the day of the accident by other reasons). All cases of ARS were stated to have happened to firemen and workers involved immediately in the accident, while there was no case of ARS among inhabitants around the Chernobyl site. This opinion of the former USSR authorities was succeeded till now in reports of international organization such as IAEA, WHO, OECD/NEA [2-4].
Along with the process of the collapse of the USSR, there appeared several publications that indicate a number of cases of ARS among inhabitant around the Chernobyl site. Our attention should be paid to the following two reports. The first one is the secret protocols of the Operative Group of the Politic Bureau of the Central Committee of the Communist Party of the Soviet Union, disclosed in 1992 by Alla Yaroshinskaya [5, 6]. Many pieces of information can be found in this document about ARS among inhabitants, including those for children. She contributed herewith an article, ² Impact of Radiation on the Population during First Weeks and Months after the Chernobyl Accident and Health State of the Population 10 Years Later.² One sentence is cited here from the protocol on May 10, 1986: ² The total number of persons in hospitals is 8,695, including 238 persons with diagnosis of radiation syndrome, 26 of which are children.² Another important report about ARS was made by Vladimir Lupandin [7]. He investigated in 1992 medical records made in May-June 1986 at the Central District Hospital of the Khoiniki district of the Gomel region of Belarus, located adjacent to the Chernobyl site. Although a theft of the medical archive happened in November 1990, he found 82 medical records of inhabitants who suffered from irradiation. Among them he confirmed 8 cases of ARS. Details of his finding are described in his article ² Chernobyl 1996: New Materials concerning Acute Radiation Syndrome around Chernobyl”
Apparently, findings by Yaroshinskaya and Lupandin are in contradiction to the opinion of the authorities. It seems to be difficult to reconcile the two different opinions about the occurrence of ARS among inhabitants around Chernobyl. So, we can only say, which is true? In order to answer this question, we come up to another question. How much was the level of irradiation for inhabitants? Could it be the level that causes ARS?
In this report we try to evaluate irradiation dose of inhabitants around Chernobyl until their evacuation, based on the data which became available recently.
Materials and methods
Under the tradition of the Soviet system, the information concerning the consequences of the Chernobyl accident had been treated to be secret. As also disclosed by Yaroshinskaya [5], for example, the Soviet government issued on June 27, 1986 an order, ² To consider as secret: data about the accident; data about results of treatment of sufferers; data on irradiation of personnel involved in liquidation of the consequences of the disaster.² Although some data on the radiation situation were included in the USSR report in 1986, they were not enough to do independent analysis or to check the validity of estimates contained in it. Through the Soviet period, we could only find fragmentary information about the radiation situation soon after the accident around the Chernobyl site.
In 1996, interesting data were presented in reports of the collaboration work between European Commission and three affected CIS countries (Ukraine, Belarus and the Russian Federation) [8].
Dose rate on May 1, 1986
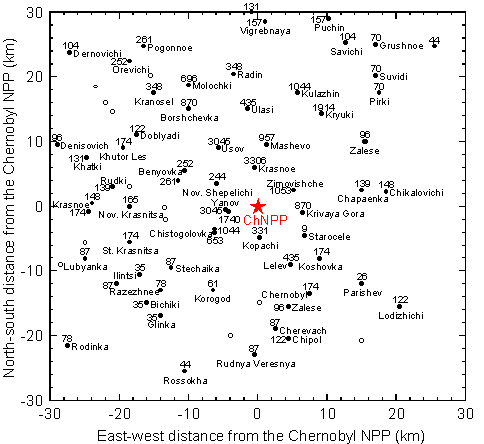
Fig. 1 shows the radiation situation at settlements within the 30-km zone around the Chernobyl site on May 1, 1986, five days after the accident [9]. It is stated that these data were measured by special teams of the Chernobyl NPP staffs and other specialist, using GM counter at 1 m above the ground.
As seen in Fig. 1, a large variation is observed in the spatial distribution of radiation situation. The maximum of 3,306 m Gy/h is observed at village Krasnoe about 6 km north from the site. High values of dose rate are generally observed at settlements in the north half of the 30-km zone, which corresponded to the fact that radioactive clouds from the destroyed reactor moved to north-west and north from the destroyed in the first and second days after the accident [1, 10].
It was reported that the first evacuation of 45,000 inhabitants in Pripyat, a city built next to the Chernobyl site for workers of the station, was carried out on April 27, 1986, the next day of the accident [1]. The second evacuation of inhabitants who were living within the 30-km zone was made during the period from May 3 to May 5 [11]. So, these people stayed in the highly contaminated area for 7-9 days. The number of inhabitants evacuated in the stage was reported to be 90,000 [1]. The evacuation was finally completed on May 14 [11].
Dose rate change during the first days in the Khoiniki district
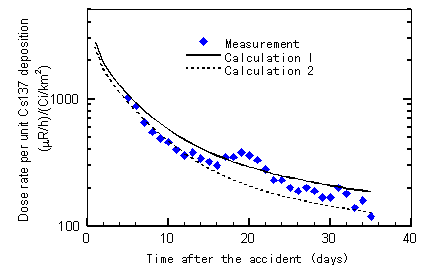
An interesting data on dynamics of dose rate change measured in the Khoiniki district, which corresponds to the north-west part of Fig. 1, is also presented in the same EC/CIS report [12]. In Fig. 2 is shown the measured change of dose rate normalized per unit deposition of 137Cs in the Khoiniki district together with calculated ones by us. The measurement of dose rate was carried out by Civil Defence of Belarus, maybe, with GM counter.
In the solid line of our calculation (calculation 1), the deposition of other nuclides (18 nuclides) than 137Cs were determined from their deposition ratios to 137Cs reported by Izrael et.al. [13], values of which are shown in Table 1 together with dose rate conversion factors per unit density of each nuclide on the ground. Calculation of exposure rate in air per unit deposition of 137Cs was made by the next equation.
![]() (1)
(1)
where r(t): g -ray exposure rate at time t calculated at 1 m above the ground from the mixture of deposited nuclides, densities of which are normalized to unit 137Cs deposition, (m R/h)/(Ci/km2 of 137Cs)
DFi: exposure rate conversion factor from unit density of nuclide i on the ground, calculated by us based on the infinite plain model, (m R/h)/(Ci/km2)
DRi(t): density ratio of nuclide i to 137Cs at time t.
If we can reconstruct dynamics of exposure rate changes during the first days after the accident, external irradiation at each settlement can be calculated by combining the dose rate data in Fig 1 with their changes.
As seen in Fig. 2, the solid line (calculation 1) gives a little higher exposure rate than the measured one for the first two weeks after the accident. This period is critical in dose formation of inhabitants who were evacuated from May 3 to May 5. So, in order to fit the calculated curve to the measured, we reduced the deposition ratios for 95Zr and 140Ba to halves of them in Table 2. Thus, we calculated the dotted line (calculation 2), showing a good agreement with measurements for the first two weeks.
In the curve of the measured data, an increase of exposure rate is noted from May 16 to May. 20. It can be considered to reflect the late phase release from the destroyed reactor that is recently reported by Dobrynin et.al. [14], which may support our reduction of deposition ratios for 95Zr and 140Ba.
Procedures for dose estimation
Dose values of external irradiation from deposited radionuclides on the ground, external irradiation from radioactive clouds in air, and internal dose through the inhalation path are evaluated for inhabitants who stayed in their settlements until evacuation, based on the following procedures.
Step 1: Calculation of external dose equivalent from deposited nuclides on the ground
The next two assumptions were made in order to calculate external irradiation.
At first, the deposited density of 137Cs, ACs137 [Ci/km2] is calculated by the next equation,
![]() (2)
(2)
where Rm(May 1) : absorbed dose rate in air on May 1, shown in Fig.1, m Gy/h,
r(May 1): exposure rate calculated by (1) at 12:00 on May 1 per unit deposition of 137Cs, (m R/h)/(Ci/km2),
0.0087: conversion factor from m R to m Gy.
By the way, density on the ground of i nuclide, Ai,(t) other than 137Cs can be easily obtained from values of deposition ratios given in Table 1.
Then accumulated exposure dose in air until the time of evacuation, Dexp [R] is calculated by the next equation,
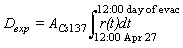 (3)
(3)
The day of evacuation was obtained or assumed from the information in the paper by Likhtarev et.al. [11].
Finally accumulated exposure dose in air is converted into the value of external dose equivalent, Dground [Sv], using the following relation.
Dground = 0.61× 0.82× 0.0087× Dexp (4)
where 0.0087: conversion factor of R to Gy
0.82: conversion factor of Gy to Sv
0.61: apparent shielding factor of inhabitants.
Values of theses three parameters were chosen also from the data by Likhtarev et.al.[11]. The apparent shielding factor of 0.61 can be applied to rural people who spent outdoors for 0.42 faction of day and stayed in wooden houses (shielding factor = 0.33) for the rest of time.
Step 2: Estimation of external dose equivalent from radioactive clouds
Usually, in assessments of the consequences of hypothetical nuclear accidents, the amount of ground deposition is evaluated from air concentration of radionuclides. Here, inversely, integral concentrations in air of nuclide i, Ci, [Ci/m3× sec] is evaluated, assuming deposition velocity of deposited nuclides,
 (5)
(5)
where Ci: integral concentration in air of nuclide i, Ci/m3× sec,
Vi: deposition velocity of nuclide i, m/s.
0.005 m/sec for iodine
0.002 m/sec for other nuclides
Values of Vi are obtained from the Reactor Safety Study [15, 16].
External dose equivalent from radioactive clouds, Dcloud [Sv] is obtained from the next equation
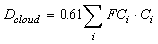 (6)
(6)
where, FCi: dose conversion factor of nuclide i calculated based on submersion model [16], Sv/(Ci/m3× sec),
0.61: apparent shielding factor chosen as the same as Step 1.
Step 3: Estimation of internal dose equivalent from inhalation of contaminated air
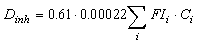
Based on the integral concentration obtained in Step 2, internal dose equivalent from inhalation, Dinh [Sv] can be calculated from the next relation,
where, Ci: integral concentration of nuclide i,
|
Table 2 Estimates of average dose for inhabitants at settlements in the 30-km zone until evacuation |
||||||||
|
Settlement |
Dose rate on May 1 (mGy/h) |
Day of evacuation |
Deposition of 137Cs (Ci/km2) |
Accumulated exposure in air (R)* |
External dose (Sv ) |
Inhalation dose ( Sv) |
Total dose ( Sv) |
|
|
Ground |
Cloud |
|||||||
|
Usov |
3.045 |
May 3 |
430 |
64 |
0.28 |
0.04 |
0.13 |
0.44 |
|
Krasnoe |
3.306 |
May 3 |
470 |
69 |
0.30 |
0.04 |
0.14 |
0.48 |
|
Kryuki |
1.914 |
May 5 |
270 |
40 |
0.17 |
0.02 |
0.08 |
0.28 |
|
Borshchevka |
0.870 |
May 5 |
120 |
18 |
0.08 |
0.01 |
0.04 |
0.13 |
|
Chernobyl |
0.174 |
May 5 |
25 |
3.6 |
0.02 |
0.002 |
0.01 |
0.02 |
FIi
: inhalation dose conversion factor of nuclide i for 1 week after incorporation, Sv/Ci,0.00022: breathing rate, m3/sec,
0.61: apparent shielding factor.
Values of FIi are specially calculated by us to obtain internal dose for the short period (1 week) after incorporation, using the next equation.
![]()
where FIicrpi: dose commitment conversion factor from inhalation of nuclide i evaluated by ICRP [17]
FIrssi(7day) and FIrssi(50 year): internal dose equivalent conversion factor of nuclide i, for 7 days and 50 years, respectively, given by the RSS [16].
The contribution of external irradiation from radioactive rare gases and internal dose from the path of ingestion are neglected in our procedures.
Results and discussion
The main purpose of this report is to investigate the radiation situation around the Chernobyl site from the viewpoint whether or not there was a possibility of irradiation that caused acute radiation syndrome among inhabitants until their evacuation. On the other hand, it is difficult to say univocally the level of irradiation dose that causes acute radiation syndrome because definition of acute radiation syndrome itself is of unclear nature and it depends on many factors such as irradiation conditions and individual factors. According to ICRP [18], acute irradiation of 0.5 Sv is evaluated to be a threshold of slight bone marrow injury. Following the traditional conception about ARS, however, we consider here 1 Sv of dose equivalent as the criterion of ARS.
Average irradiation dose
We have applied the above procedures of dose assessment to five settlements; villages Usov, Krasnoe, Kryuki, Borshchevka and Chernobyl city. Krasnoe is the highest point in Fig. 1. About Usov (10km to NW) and Chernobyl (15km to SE), external irradiation is also evaluated by Likhtarev et.al. [11]. The report of Lupandin includes typical cases of acute radiation syndrome in Borshchevka (18km to NW). Kryuki (17km to NE) is located in the area of most highest level of 137Cs contamination [19].
Results of our calculation are summarized in Table 2. As seen in Table 2, the highest dose of 0.48 Sv was obtained for inhabitants at village Krasnoe. About 60 % of the total dose were external irradiation from deposited nuclides on the ground. About 30 and 10 % were from external irradiation from clouds and inhalation path, respectively. According to the results of Table 2, the average dose of inhabitants in settlements within the 30-km zone around the Chernobyl site did not reach 1 Sv of the criterion for ARS,
|
Table 3 Dose value of 95 percentile and fraction of inhabitants exceeding 1 Sv |
|||
|
Settlement |
Average total dose (Sv) |
95 percentile (Sv) |
Fraction exceeding 1 Sv (%) |
|
Usov |
0.44 |
1.65 |
15 |
|
Krasnoe |
0.48 |
1.79 |
18 |
|
Kryuki |
0.28 |
1.04 |
6 |
|
Borshchevka |
0.13 |
0.47 |
<1 |
|
Chernobyl |
0.02 |
0.09 |
~ 0 |
Distribution of irradiation dose for inhabitants
It should be noted that values in Table 2 are given as estimates for average doses of inhabitants in each settlement. Actual doses to individuals were naturally distributed around average doses. In order to investigate the possibility of ARS, therefore, the distribution of individual dose among inhabitants should be taken into consideration. Many factors are considered to be related with possible distribution of irradiation doses; inhomogeneity of contamination, variation of individual behavior, difference of shielding ability of buildings, etc.
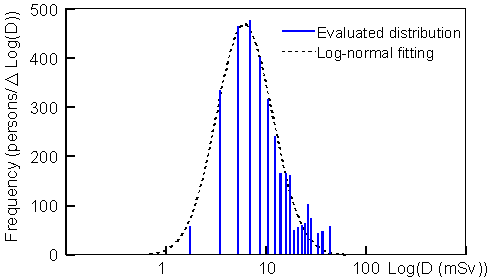
In the course of the EC/CIS work, individual external doses were evaluated for 335 inhabitants who evacuated from village Paryshev [20], located about 20 km south-east from the Chernobyl site (26 m Gy/h on May 1, 1986, see Fig.1). Questionnaires on daily behavior and living conditions of individuals until their evacuation were used to estimate individual external dose. The result of their dose distribution is redrawn in Fig. 3 together with a fitting curve of log-normal distribution. As seen in Fig. 3, the variation of external dose can be described very well by the log-normal distribution. Based on the log-normal fitting, the 95 percentile point of the dose distribution is calculated to be 2.92*(average dose), where 2.92 = 100.284*1.64. Values of 0.284 and 1.64 are the standard deviation and the multiplying factor to get the 95 percentile point, respectively.
Here it is assumed that the distribution of external dose in Paryshev can be applied to other villages. It is also assumed that the distribution of inhalation dose has a wider deviation than that of external irradiation by two times, giving its 95 percentile point as 5.84*(average inhalation dose). Thus, 95 percentile doses and percentages of inhabitants dose of which is expected to exceed 1 Sv are calculated in five settlements in Table 2 and shown in Table 3.
Table 3 shows that substantial parts of inhabitants at Krasnoe (18 %) and Usov (15 %) could receive irradiation exceeding 1 Sv before their evacuation. At Usov 159 persons were reportedly there at the time of the accident [11], which means 25 persons exceeded 1 Sv.
Comparison with other evaluations
Estimates of collective external does for evacuees from the 30-km zone are given in the 1986 USSR report [1]. Those values are divided into groups of settlements dependent on the distance from the Chernobyl site. Average external doses are calculated and shown in Table 4. The average external dose of 24,200 people who were at 3 - 15 km at the time of the accident is calculated to be 0.45 Sv, and that of 65,700 people at 15 - 30 km is 0.05 Sv. These doses are consistent with our estimates shown in Table 3 although the 1986 report denied the occurrence of ARS among inhabitants.
A comprehensive work on external dose reconstruction for evacuees was made by Ukrainian scientists, Likhtarev et.al. [11]. Based on the questionnaires on daily behavior to 36,000 evacuees, they reconstructed individual external dose of about 31,000 evacuees from the 30-km zone, including about 14,000 in Pripyat city. The average and the maximum external doses of the evacuees (excluding the people in Pripyat) were evaluated to be 0.00182 Sv and 0.383 Sv, respectively. Based on these estimates, it is difficult to suppose the occurrence of ARS among inhabitants around the Chernobyl site. Table 5 is a comparison of external dose between by the present author and by Likhtarev et.al. Our estimates are lager than those by Likhtarev et.al. by about 3 times. The reason of the difference is unknown so far although the same values of shielding factors and dose conversion are used.
Several points should be mentioned about the work by Likhtarev et.al. At first, they excluded about 4,000 persons from their dose reconstruction with the reason that they stayed in highly contaminated areas or visited the Chernobyl station. Secondly, their work is mostly related to the territory of Ukraine. As seen in Fig. 1, highly contaminated areas extended to the north part of the 30-km zone, which belongs to Belarus.
|
Settlement |
Average external dose (Sv) |
A/B |
|
|
Present work (A) |
Likhtarev (B) |
||
|
Usov |
0.32 |
0.118 |
2.7 |
|
Chernobyl |
0.018 |
0.0060 |
3.0 |
Conclusion
Our findings are summaized as follows:
It should be noted that our estimation does not include contributions of external dose from rare gases and internal dose from ingestion. Negligence of these paths does not mean they were negligible. It is simply because they are difficult to be evaluated.
It is also noted that a typical case of ARS in the report of Lupandin is observed in village Borshchevka, where ARS is difficult to be expected from our estimation. This case can be considered to be examples beyond the method of our estimation because the patient is reported to have stayed on the dike of Pripyat river from April 26 to 27 for fishing. Lupandin mentioned the possibility of a lot of such cases.
Finally, we have to say that there are still a lot of questions that should be answered about the Chernobyl accident. For example, the authors have one question for more than ten years. How much was the irradiation level that was received by young soldiers of the Chemical Troops of the Soviet Army who arrived at Chernobyl on the next day of the accident and supposedly took part in the first works for liquidation in the atmosphere of several hundreds of roentgen per hour?
References
1.USSR State Commission on the Utilization of Atomic Energy, August 1986.
2.“One Decade after Chernobyl: Summing Up the Consequences of the Accident”, STI/PUB/1001, IAEA, 1996.
3.“Health Consequences of the Chernobyl Accident: Results of the IPHECA Projects and Related National Programmes”, WHO, 1995.
4.OECD/NEA, “Chernobyl: Ten Years on Radiological and Health Impact”, November 1995.
5.A. Yaroshinskaya, IZVESTIYA, April 24, 1992.
6.A. Yaroshinskaya, “Chernobyl: Top Secret”, Drugie-berega, Moscow, 1992.
7.V. Lupandin, Invisible Victims, NABAT 36, Minsk, October 1992.
8.I.K.Baliff and V.Stepanenko ed., “Retrospective Dosimetry and Dose Reconstruction”, Experimantal Collaboration Project ECP-10. EUR 16540, EC, 1996.
9.ECP-10, p17.
10.Yu.A.Izrael, Chernobyl: Radioactive Contamination in the Environment, Gidrometizdat, 1990 (in Russian)
11.I.A.Likhtalev et.al., “Retrospective Reconstruction of Individual and Collective External Gamma Doses of Population Evacuated after the Chernobyl Accident”, Health Physics, 66(6), (1994) 643-652.
12.ECP-10, p109.
13.Yu.A.Izrael et.al., Meteorology and Hydrology, 1987 No.2, pp.5-18 (in Russian).
14.Yu.L.Dobrynin and P.B.Khramtsov, Radiation Protection Dosimetry, 50 pp.307-10 (1993).
15.Reactor Safety Study, WASH-1400 Draft, USAEC, 1974.
16.Reactor Safety Study, WASH-1400, USNRC, 1975.
17.K.Kawai et.al., Table of Committed Effective Dose Equivalents According to the ICRP Publication 30, JAERI-M 87-172 (1987)
18.ICRP Publication 60, 1990.
19.Bulletion of Ecological Situation of Evacuated Zone, No.1 1996, Chernobyl-Interform (in Ukrainian).
20.ECP-10, p.25.